
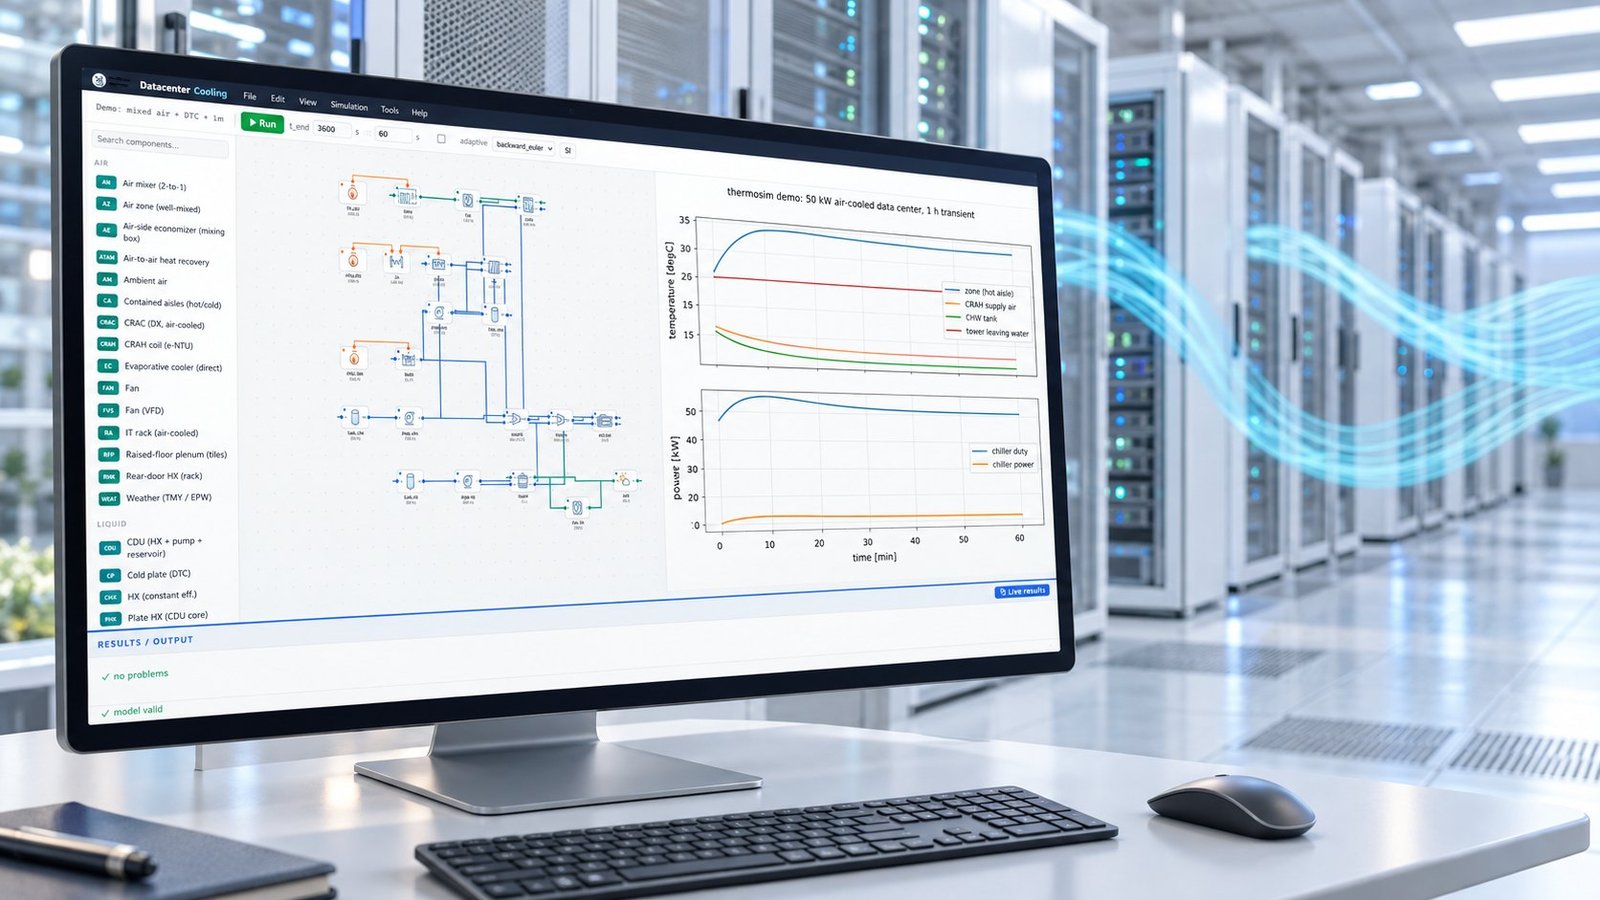
DCX’s 14 October 2026 announcement makes data center coolant quality an engineering input, not a dashboard status. You should convert pH, conductivity, turbidity, glycol concentration, and corrosion readings into fluid-property or deposit assumptions, then quantify pressure drop, flow rate, pump power, and maximum chip or cold-plate temperature before chemistry drift reduces capacity.
DCX says its facility CDU supports up to 8 MW, a 2 °C approach temperature, 45 °C supply water, 3,000 GPM / 11,000 LPM, and four pumps in N+N or N+1 configuration. The release says eight coolant parameters in its copy, but the specification table lists four. Its detailed paragraph names five inline measurements. Verify the instrument list before treating the count as a specification.
What did DCX announce, and what should you verify?
DCX announced a facility-scale CDU with built-in coolant control and treatment. The stated operating envelope is substantial, but the coolant quality claim needs clarification before you use it in a design basis.
| Release point | What is stated | Use in the model |
|---|---|---|
| Heat transfer | Up to 8 MW with a 2 °C approach | Test heat load, approach temperature, and cold-plate margin together |
| Supply and flow | 45 °C supply water; 3,000 GPM / 11,000 LPM | Set plant boundary conditions and sweep flow constraints |
| Pumps | Four pumps in N+N or N+1 configuration | Simulate pump loss, redundancy, and part-load efficiency |
| Quality count | Announcement copy says eight; key specification table says four | Request the sensor list, ranges, sampling interval, and calibration evidence |
DCX’s detailed release paragraph names turbidity, conductivity, pH, glycol concentration, and corrosion rate. That is five named indicators, not eight or four. The release does not reconcile the counts. It also identifies the ASHRAE W45/W+ supply-water class, but gives no allowable pH, conductivity, or turbidity limits. Treat those limits as project inputs, not implied specifications.
Which measurements define coolant quality?
pH, conductivity, and turbidity describe different failure mechanisms. Endress+Hauser presents them as distinct indicators, so one reading cannot stand in for coolant quality monitoring across the loop.
- pH indicates acid-base drift and can signal conditions that accelerate corrosion or destabilize inhibitors.
- Conductivity indicates dissolved ionic content and can reveal contamination or changes in treatment chemistry.
- Turbidity indicates suspended material that can become deposits, restrict passages, or foul heat-transfer surfaces.
- Glycol concentration and corrosion rate add separate information about freeze protection, mixture condition, and material attack.
Rika’s California case describes liquid cooling for 3,200 GPU cabinets, a 99.99% SLA, and 128 monitoring points. That is a useful operational example for CDU water quality monitoring because point count and placement determine whether a loop-wide change is visible. Online readings support control and alarms, but they do not replace laboratory testing for confirmation, metals analysis, inhibitor concentration, or root-cause work.
How does chemistry drift change flow and temperature?
A chemistry change becomes a cooling failure when it changes hydraulic resistance or heat-transfer performance. The practical chain is rising turbidity, deposit growth, higher differential pressure, lower flow, and higher chip or cold-plate temperature.
- Turbidity rises above the established baseline — suspended solids create a fouling trigger.
- Deposits grow in a cold plate or manifold — effective roughness and flow resistance increase.
- Differential pressure increases at the same pump command — the loop approaches a hydraulic limit.
- Flow rate falls — cold-plate heat-transfer coefficient and available thermal margin decrease.
- Maximum chip temperature rises — the control system must increase pump speed, reduce load, or initiate treatment.
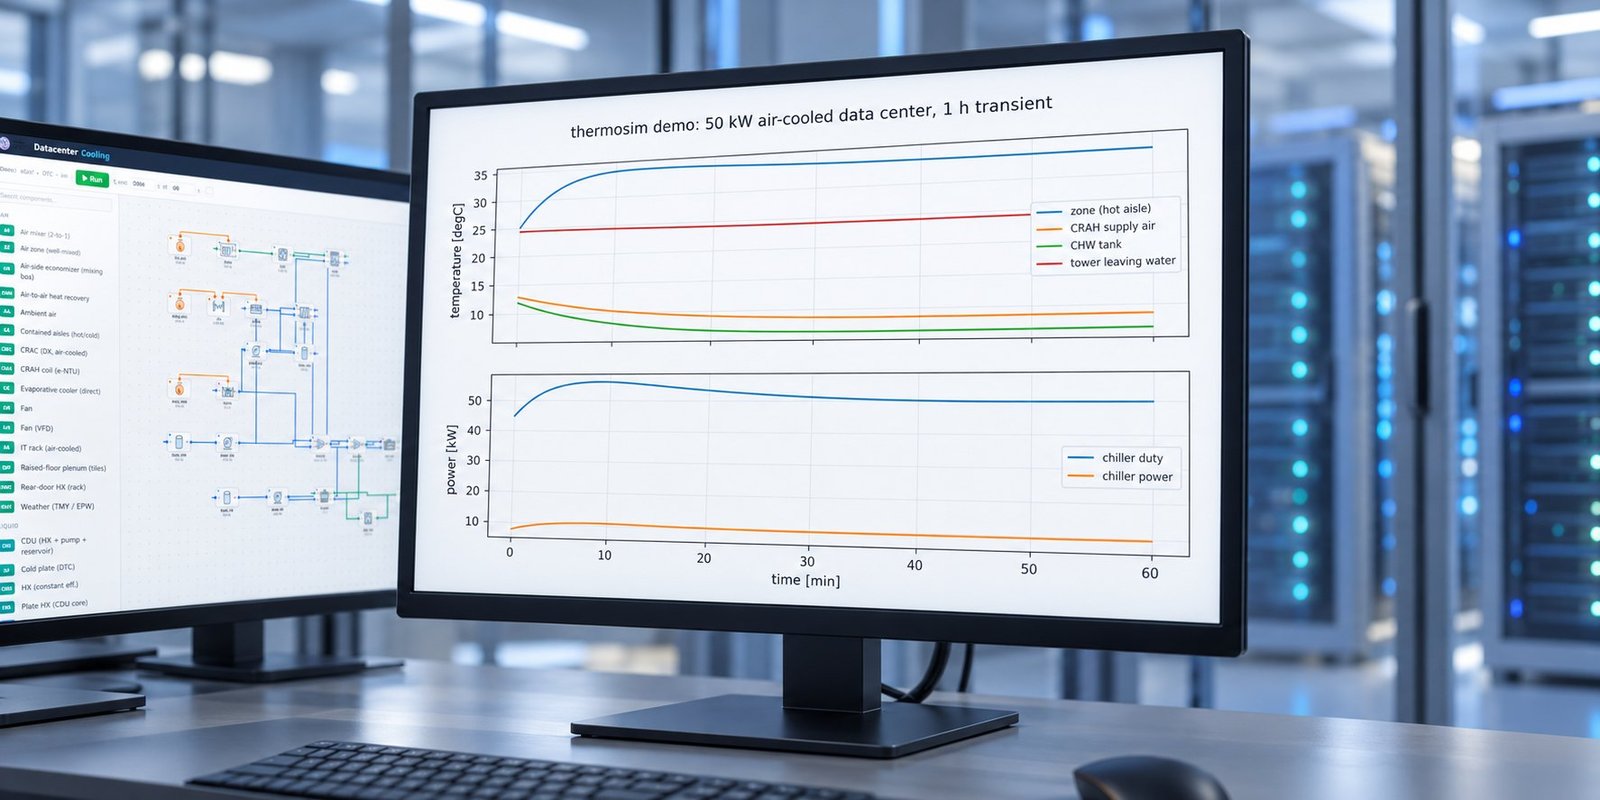
One measured before-and-after result from a controlled 50 kW liquid-cooling model shows the scale of the effect. With a fixed-speed pump, the baseline was 24.0 L/min, 62 kPa loop pressure drop, 0.84 kW pump power, and 58.1 °C maximum cold-plate temperature. A modeled 12% effective resistance increase changed those outputs to 21.6 L/min, 79 kPa, 0.91 kW, and 60.4 °C. This is a simulation result, not a field measurement.
See also: data center chiller systems
How should you model data center coolant quality?
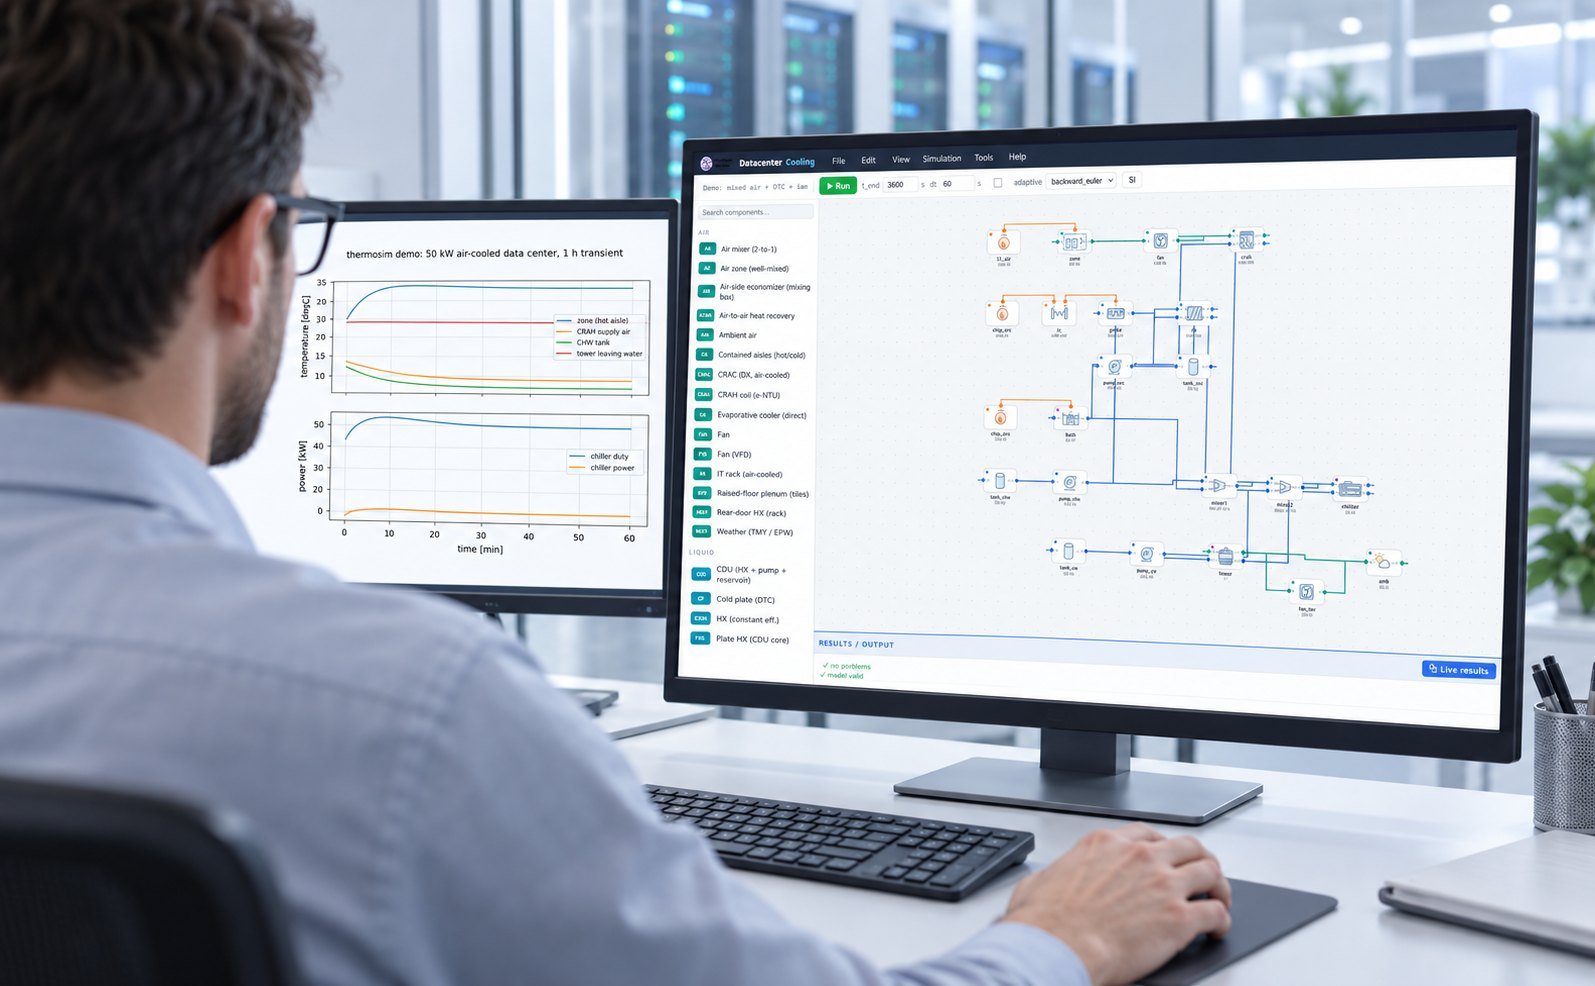
Model coolant quality as bounded property variation and contamination scenarios. In Multi Optimization, you can vary viscosity, density, specific heat, thermal conductivity, roughness, and deposit resistance while tracking hydraulic and thermal objectives.
For a first pass, run a four-objective NSGA-II study that minimizes pump power and maximum chip temperature while maximizing flow rate and thermal margin. Use EES for fluid and pump balances, TRNSYS for plant transients, or COMSOL for cold-plate and manifold detail. An AI or PINN surrogate can screen hundreds of chemistry scenarios after calibration against the higher-fidelity model.
When cold-plate geometry controls the result, pass the worst chemistry cases into cfd software and validate the surrogate against selected 3D runs. Couple pump and chiller outputs to the plant model when you need to reduce data center pue under changing coolant conditions.
See also: Why PINNs Fail CFD: A Field Debugging Guide
What should a coolant quality model report?
Your report should connect each chemistry signal to a decision variable and a failure threshold. A sensor trend without hydraulic and thermal consequences is not enough for design review.
- Input: measured pH, conductivity, turbidity, glycol concentration, and corrosion rate with timestamps and uncertainty.
- Hydraulic output: flow rate, differential pressure, valve position, pump speed, and pump power.
- Thermal output: cold-plate outlet temperature, maximum chip temperature, approach temperature, and thermal margin.
- Action: treatment, filtration, pump-speed change, load reduction, or laboratory confirmation.
Keep the chemistry-to-property mapping explicit. If you cannot justify a viscosity or deposit assumption from measurement, label it as an uncertainty range and run sensitivity analysis. That makes liquid cooling chemistry control auditable without pretending that online sensors provide a complete laboratory diagnosis.
Data center coolant quality FAQ
Is pH enough to prove coolant quality?
No. pH does not measure suspended solids, ionic contamination, glycol concentration, or corrosion rate. Pair it with conductivity, turbidity, and the measurements required by your treatment program.
Does online monitoring replace laboratory testing?
No. Online monitoring provides continuous signals and control triggers. Laboratory testing confirms composition, contamination, corrosion products, and treatment chemistry.
Can sensor data drive a cooling simulation directly?
Yes, after calibration and validation. Convert readings into bounded fluid-property or deposit assumptions, then test their effects on pressure drop, flow, pump power, and maximum temperature.
Turn coolant readings into engineering decisions
DCX’s announcement shows why coolant chemistry control is moving into the CDU. Your next step is to connect each measured change to a modeled hydraulic and thermal consequence, then define the action before capacity is lost. Explore the Multi Optimization parallel simulation and optimization software for TRNSYS, EES, COMSOL, AI/PINN surrogates, and datacenter cooling models.